When the Going Gets Tough...
We hope this note finds you and your family doing well. We wanted to touch base during this volatile time for the markets. As the noted investor Shelby M.C. Davis put it, “History provides a crucial insight regarding market crises: they are inevitable, painful, and ultimately surmountable.”
The S&P 500 is now off over 16% for the year, which puts it into correction territory, and the Nasdaq is down over 26%. While it has been a while since we have had this much volatility, it is not rare. This is the 21st time this has happened in the last 50 years and the 5th time this has happened since 2015.
What is causing this volatility? The markets have been shaken this year by a flurry of investor worries. For one thing, inflation is at its highest rate in decades. This has forced the Federal Reserve to kick off a monetary policy tightening campaign, which includes increasing interest rates, and the markets are trying to figure if that’s doable without tipping the country into a recession. On top of these fears, we are dealing with geopolitical factors: strict pandemic lockdowns in China, Russia’s invasion of Ukraine, and ongoing political conflicts within the United States.
What has made 2022 even tougher is typically when stocks go down, we see a surge in the bond market that helps even out moderately invested portfolios that hold both types of assets. However, with interest rates rising, bonds have not been a safe place to hide in the short term. That said, even with volatility on both sides of the markets, we believe it doesn’t make sense to sell out of bonds after a tough period. That is backed up by historical data, which you can see below in a graph created by our friends at Blackrock: while we are in one of the worst two-year periods for bond returns, in the five worst such periods on record the following two-year period made up that loss and then some.

So, what do we do? We are recommending that we ride through the storm. As we’ve discussed in past newsletters, trying to time the market is a fool’s errand – it just doesn’t work. Our friends at JP Morgan created a chart that illustrates this point very well:
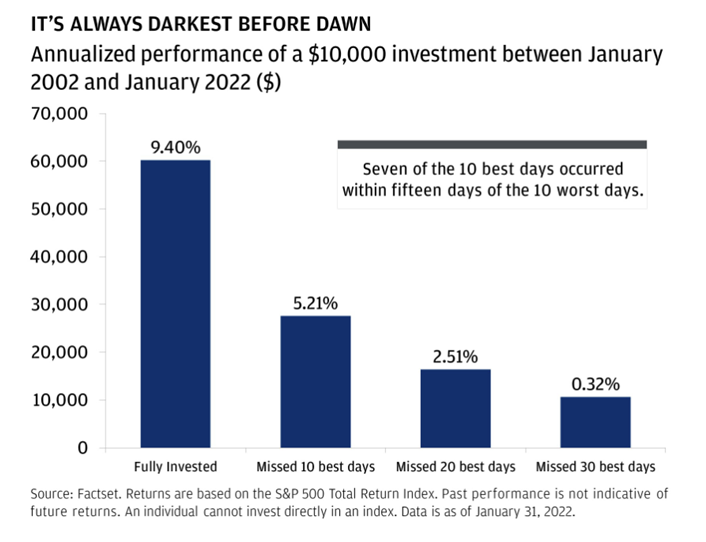
We can’t offer a timeline for when we expect to see upward momentum once again, but there are a few nuggets of good news out there.
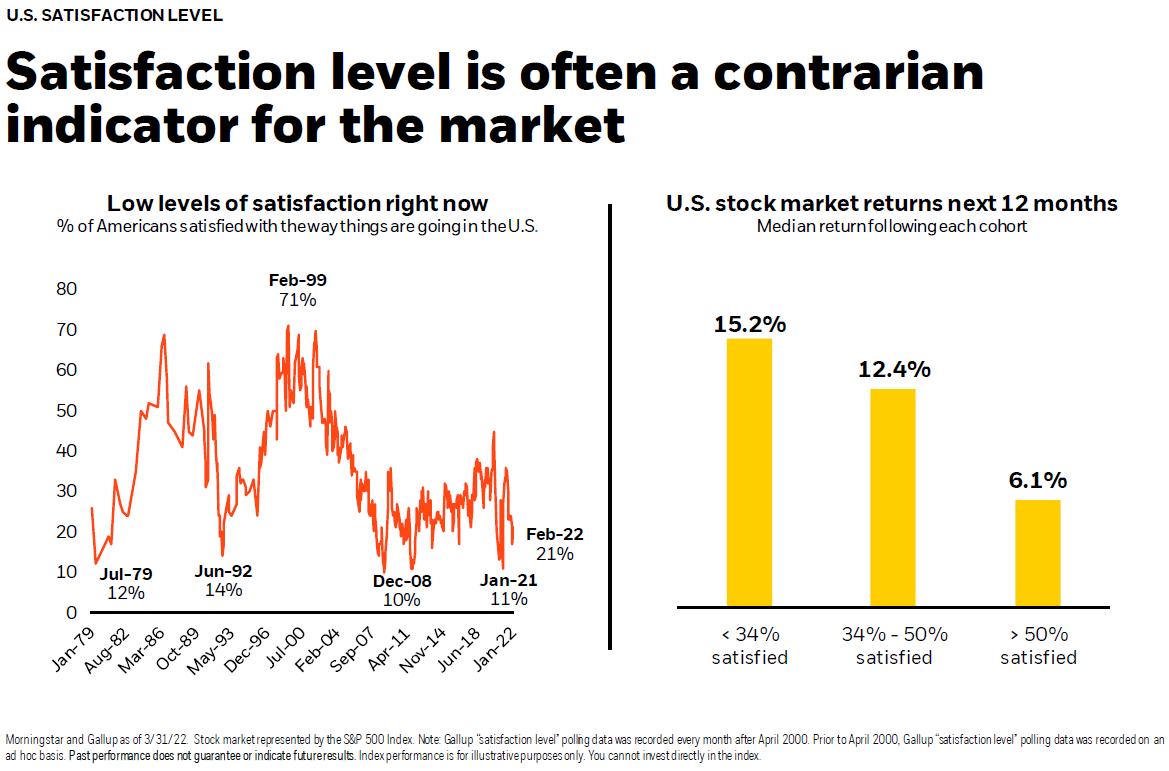
Satisfaction levels with how things are going within the US are at their lowest in 50 years, but counterintuitively that tends to be followed by an upward swing in the stock market over the next year. Historically, low satisfaction signals a bottom to the market, as you can see in the chart below from Blackrock.
We can see signs that the bottom may be here already. Among the more than 3,500 stocks that comprise the Nasdaq, which is a growth-oriented index, nearly half are already down 50% or more from their highest price within the past year.
As companies release their earnings reports, these results have largely been better than expected relative to the downturn in their stock prices. This suggests that consumer fears may have more to do with the downturn than is warranted based how companies are actually performing.
And on top of that, companies continued to hire broadly in April, marking the twelfth straight month of 400,000 or more worker additions to payroll.
We completely understand how painful it is to watch the market drop on a day to-day basis. We continue to believe that the two pillars of long-term success are a well-diversified portfolio and a long-term financial plan. Knowing how much we need and when we need it helps us determine how much negative market event today affects that long-term plan.
Please do not hesitate to reach out to us with any questions or concerns that you may have. We are grateful to be working with you.